Only released in EOL distros:
Package Summary
rxbag_plugins contains plugins for the rxbag GUI tool.
rxbag is a graphical framework for analyzing bag (log) files. rxbag_plugins provide visualizers for messages of different types.
Some icons from the Silk icon pack are used, which is available from famfamfam.com.
- Author: Tim Field
- License: BSD, Creative Commons
- Repository: ros-pkg
- Source: svn https://code.ros.org/svn/ros-pkg/stacks/visualization/tags/visualization-1.4.1
Package Summary
rxbag_plugins contains plugins for the rxbag GUI tool.
rxbag is a graphical framework for analyzing bag (log) files. rxbag_plugins provide visualizers for messages of different types.
Some icons from the Silk icon pack are used, which is available from famfamfam.com.
- Author: Tim Field
- License: BSD, Creative Commons
- Source: svn https://code.ros.org/svn/ros-pkg/stacks/visualization/branches/visualization-1.6
Package Summary
rxbag_plugins contains plugins for the rxbag GUI tool.
rxbag is a graphical framework for analyzing bag (log) files. rxbag_plugins provide visualizers for messages of different types.
Some icons from the Silk icon pack are used, which is available from famfamfam.com.
- Author: Tim Field
- License: BSD, Creative Commons
- Source: git https://github.com/ros-visualization/visualization.git (branch: visualization-1.8)
Usage
Any rxbag plugin in the ROS_PACKAGE_PATH is detected automatically by rxbag on start-up.
To access these plugins, launch the rxbag GUI tool (see rxbag for details), right-click on the timeline and select a topic and view type from the context menu.
Plugins
The following plugins are currently provided for rxbag:
Image
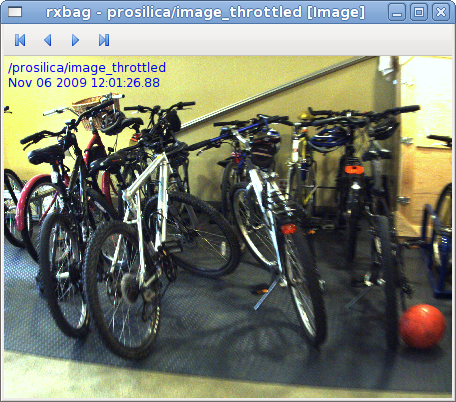
The image view displays raw image data for sensor_msgs/Image and sensor_msgs/CompressedImage messages:

The view is initially opened at the recorded resolution of the raw image. Resizing the window scales the image.
Right-clicking on the image opens a context menu which allows you to resize the window to the original resolution, or save the image to a .png file.
Plot
The plot view displays a customizable time series plot of numeric fields in a ROS message.
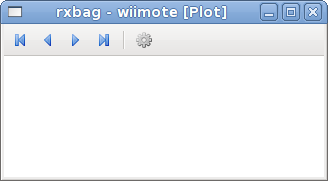
When initially opened, the plot view is empty:

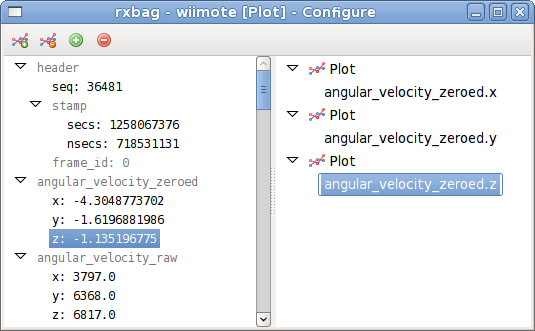
Clicking on the configure button in the toolbar ( ) opens a new window for selecting which fields in the message to plot. Message fields are displayed in the left tree, and the current plot configuration is shown in the right tree.

To plot a message field, first select a plot ( ) in the right tree. Then, either double-click a field in the left tree, or select it and click the add series button (
 ).
).
New plots are created by clicking the add plot button ( ), and are deleted with the remove plot button (
 ).
).
Series can be moved between plots by clicking and dragging, and are deleted either with the remove series button ( ) or by double-clicking on the series.
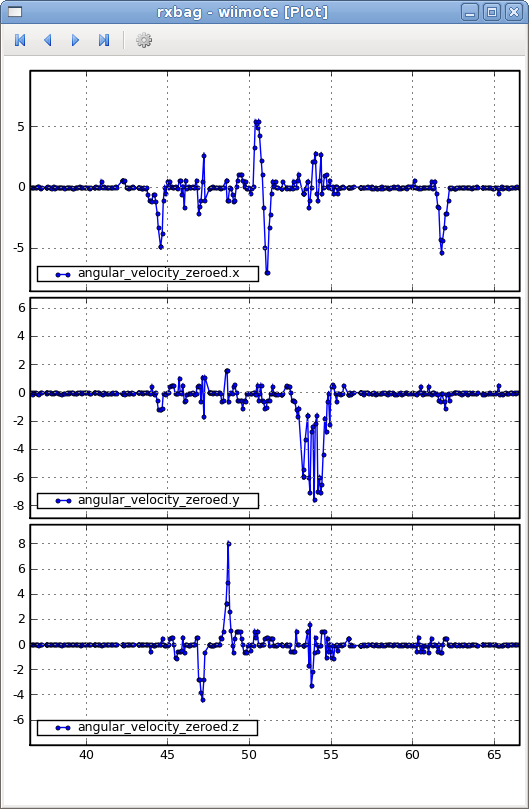
Any change to the plot configuration automatically reloads data from the bag file, updating the plot view display:

Each plot in the display shares the same X axis, which shows the number of seconds since the start of the bag file. The axis is centered on the timeline's current playhead position. The range can be configured under the Interval submenu in the context-menu accessible by clicking the right mouse button on the plot window.
To zoom/pan the plot, use mouse middle click or shift-click. Vertical movement zooms, horizontal movement pans.
Roadmap
The plugin API for rxbag is experimental and under development. Please see rxbag for roadmap information.
