Only released in EOL distros:
Package Summary
Segmentation of 3d pointclouds in clutter vs. table surface Uses classifiers trained from 104 hand-labeled clutter table scans combing 3d LIDAR and camera color information. The original training data is at: www.hrl.gatech.edu/data/clutter Brunt of the work is done by: processor.py Main file is: run_segmentation_PR2.py
- Author: Jason Okerman, Martin Schuster, Advisors: Prof. Charlie Kemp and Jim Regh, Lab: Healthcare Robotics Lab at Georgia Tech
- License: BSD
- Source: git https://code.google.com/p/gt-ros-pkg.hrl/ (branch: master)
gt-ros-pkg: clutter_segmentation. gt-ros-pkg: pr2_clutter_helper.
Running segmentation on PR2
INSTRUCTIONS:
1) Download gt-ros-pkg and add it to the ROS package path.
2) Check conditions. Be sure that python-opencv (version 2.0) is installed. This is currently required in addition to the ROS package for opencv 2.1. Roadmap: these will be combined sometime after cv 2.2 is released.
3) Edit the file run_segmentation_PR2.py so that DATA_LOCATION points to the folder on your computer which contains the 3 training XML files.
- By default these files are stored in clutter_segmentation/classifiers/. Also right now be sure this location has sub-folders 'results' and 'data'. Roadmap: this linking will be default behavior.
4) rosmake the hrl_lib package. This is the only package that requires rosmake to run.
5) Prep:
$roslaunch pr2_clutter_helper table_snapshotter.launch
- I usually run this on the PR2 itself. This starts saving laserscans from '/tilt_scan' to clouds on expected default topic name of '/table_cloud'.
Data Collection Test
$ rosrun pr2_clutter_helper acquire_pr2_data.py
- This will collect data from robot, and publish a colored-point cloud. This should pop up a couple of image visuals. View results in RVIZ by adding cloud topic listening to "table_cloud_colored" This test only tests ability to get data from PR2 and manipulate correctly.
Segmentation Test
$ rosrun clutter_segmentation run_segmentation_PR2.py
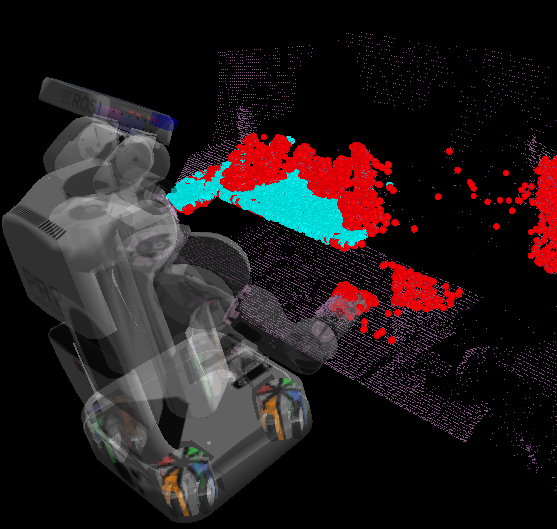
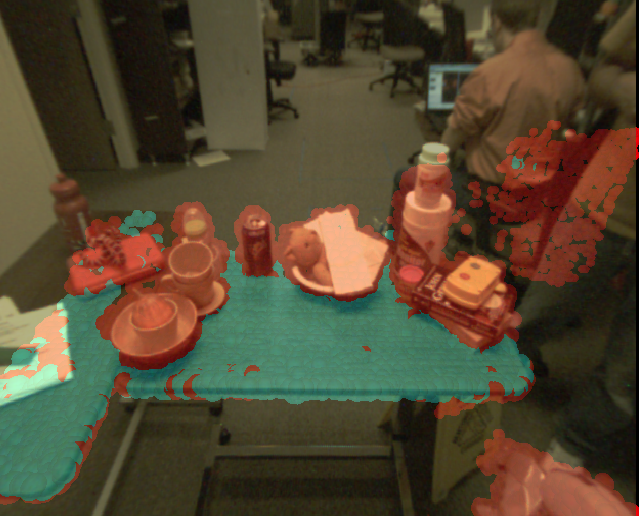
- This should pop up a couple of visuals View results in RVIZ by adding cloud topic listening to "labeled_cloud" and another for "table_cloud_colored"
Offline Test: These tests both work with Bagged data as long as the --clock attribute is set during playback.
Clutter Data Set
This package segments a point cloud into 'clutter' and 'surface' by combining the 3D information with a camera image. Classifiers were trained from 100+ cluttered tables scans.
The original training dataset is available at http://hrl.gatech.edu/data/clutter

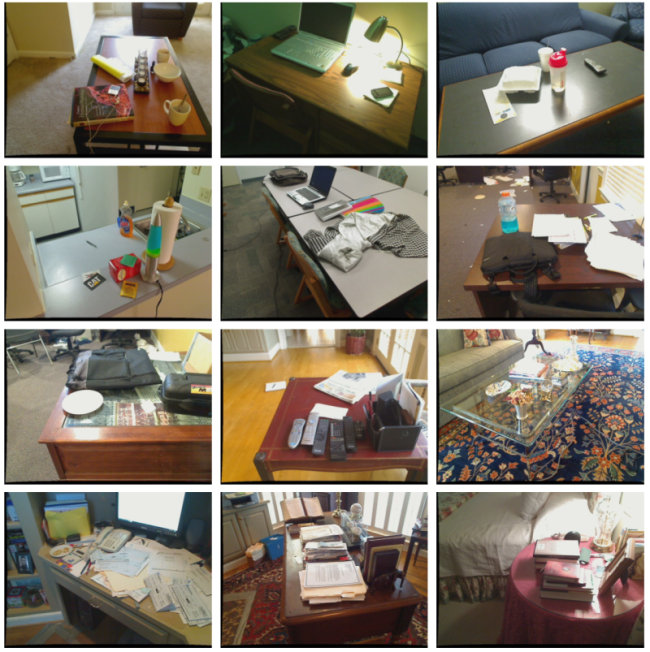
Contents
pcd format - channels are x, y, z, i (intensity), L (labels) *data is rotated so that z-axis is normal to floor plane *L has values (-1, 0, 1, 2) = (Outside camera frame, Unlabeled, Surface, Clutter)
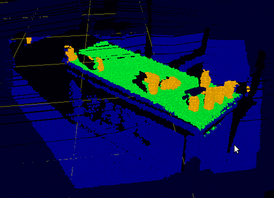
bag format - points (x,y,z), channels (intensities, labels, r, g, b) *labels channel has values (-1, 0, 1, 2) => (Outside camera frame, Unlabeled, Surface, Clutter) *Intensities channel has values from original laser scan *color channels (separate r,g,b). These three channels together contain no new information compared to 'labels'. Allows easy visualization check in RVIZ. Colors are (-1, 0, 1, 2) => (navy, blue, green, orange)
png format images
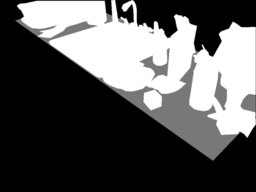
png format hand-labeled masks indicating clutter vs. table surface vs. background *colors are (Unlabeled, Surface, Clutter) = (0, 120, 255) in 8-bit grayscale. *This image is generated from polygons stored in info.txt. The cloud labels are generated from this image with points too close too the floor removed when assigning values from masks. *Because the camera and laser are not co-located (a few cm apart) the 3D labels will not be perfect.
txt info - metadata associated with each set *rotation (applied first) and tranlation btw original laser scan frame and pointcloud frame
*Note: transformation matrix btw laser frame and camera, as well as camera intrinsic parameters are the same for each set and included in the file clutter_calibration_info.txt.
*original polygons (hand-labeled) used to generate labels. Lists of (x,y) points in the image frame. *three 3D points on floor plane used to calculate ground_plane normal vector and solve for rotation and translation that has been applied to cloud. *various parameters (backwards compatability for owner)
Viewing
The 3D data can be viewed in the following ways: (1)
$ rosbag play X.bag --clock -d 5
- In RVIZ listen to topic /clutter_cloud and set Fixed_Frame to be /clutter_cloud
The delay will let you subscribe to the topic in RVIZ before the bag closes. I have added a color channel (adds 2 MB to each bag) for easy viewing of labels in RVIZ. The intensities channel can also be used to color the clouds. (2)
$ rosrun pcl_visualization pcd_viewer X.pcd
Doesn't allow viewing of the labeled 'L' channel as far as I can tell.
