Show EOL distros:
Package Summary
rqt_graph provides a GUI plugin for visualizing the ROS computation graph.
- Author: Dirk Thomas
- License: BSD
- Source: git https://github.com/ros-visualization/rqt.git (branch: fuerte-devel)
Package Summary
rqt_graph provides a GUI plugin for visualizing the ROS
computation graph.
Its components are made generic so that other packages
where you want to achieve graph representation can depend upon this pkg
(use rqt_dep to find out
the pkgs that depend. rqt_dep itself depends on rqt_graph too).
- Maintainer status: developed
- Maintainer: Aaron Blasdel <ablasdel AT gmail DOT com>
- Author: Dirk Thomas
- License: BSD
- Bug / feature tracker: https://github.com/ros-visualization/rqt_common_plugins/issues
- Source: git https://github.com/ros-visualization/rqt_common_plugins.git (branch: groovy-devel)
Package Summary
rqt_graph provides a GUI plugin for visualizing the ROS
computation graph.
Its components are made generic so that other packages
where you want to achieve graph representation can depend upon this pkg
(use rqt_dep to find out
the pkgs that depend. rqt_dep itself depends on rqt_graph too).
- Maintainer status: developed
- Maintainer: Aaron Blasdel <ablasdel AT gmail DOT com>
- Author: Dirk Thomas
- License: BSD
- Bug / feature tracker: https://github.com/ros-visualization/rqt_common_plugins/issues
- Source: git https://github.com/ros-visualization/rqt_common_plugins.git (branch: master)
Package Summary
rqt_graph provides a GUI plugin for visualizing the ROS
computation graph.
Its components are made generic so that other packages
where you want to achieve graph representation can depend upon this pkg
(use rqt_dep to find out
the pkgs that depend. rqt_dep itself depends on rqt_graph too).
- Maintainer status: maintained
- Maintainer: Dirk Thomas <dthomas AT osrfoundation DOT org>, Aaron Blasdel <ablasdel AT gmail DOT com>
- Author: Dirk Thomas
- License: BSD
- Bug / feature tracker: https://github.com/ros-visualization/rqt_graph/issues
- Source: git https://github.com/ros-visualization/rqt_graph.git (branch: master)
Package Summary
rqt_graph provides a GUI plugin for visualizing the ROS
computation graph.
Its components are made generic so that other packages
where you want to achieve graph representation can depend upon this pkg
(use rqt_dep to find out
the pkgs that depend. rqt_dep itself depends on rqt_graph too).
- Maintainer status: maintained
- Maintainer: Michael Jeronimo <michael.jeronimo AT openrobotics DOT org>, William Woodall <william AT openrobotics DOT org>
- Author: Dirk Thomas <dthomas AT osrfoundation DOT org>, Aaron Blasdel <ablasdel AT gmail DOT com>
- License: BSD
- Bug / feature tracker: https://github.com/ros-visualization/rqt_graph/issues
- Source: git https://github.com/ros-visualization/rqt_graph.git (branch: master)
Package Summary
rqt_graph provides a GUI plugin for visualizing the ROS
computation graph.
Its components are made generic so that other packages
where you want to achieve graph representation can depend upon this pkg
(use rqt_dep to find out
the pkgs that depend. rqt_dep itself depends on rqt_graph too).
- Maintainer status: maintained
- Maintainer: Michael Jeronimo <michael.jeronimo AT openrobotics DOT org>, William Woodall <william AT openrobotics DOT org>
- Author: Dirk Thomas <dthomas AT osrfoundation DOT org>, Aaron Blasdel <ablasdel AT gmail DOT com>
- License: BSD
- Bug / feature tracker: https://github.com/ros-visualization/rqt_graph/issues
- Source: git https://github.com/ros-visualization/rqt_graph.git (branch: noetic-devel)
Contents
Overview

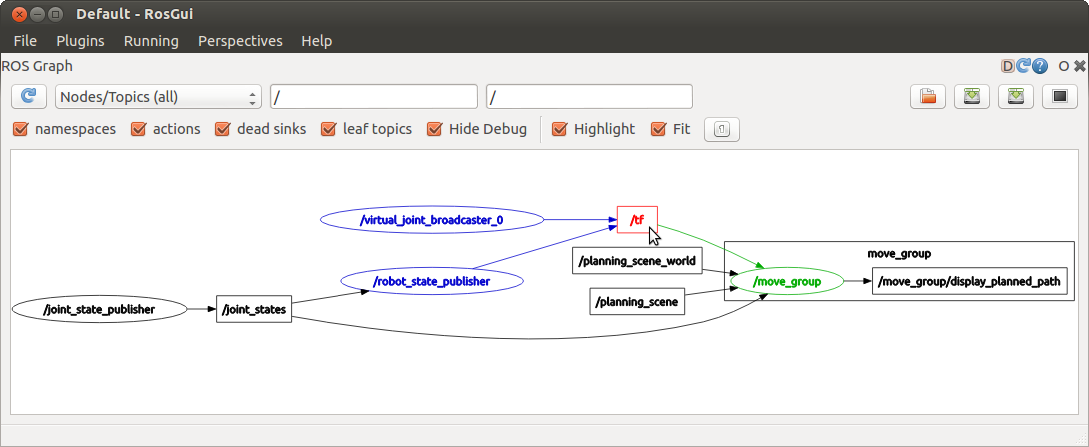
rqt_graph is the successor of rxgraph.
Topic statistics
New in ROS indigo
roscpp and rospy can measure certain statistics for every topic connection (see Topics for more details. This has to be enabled beforehand through:
$ rosparam set enable_statistics true
After that, rqt_graph will automatically annotate the ROS graph with statistics information.
Note: rqt_graph currently does not automatically update the statistics annotations. You have to hit the Refresh button to update them.
Example
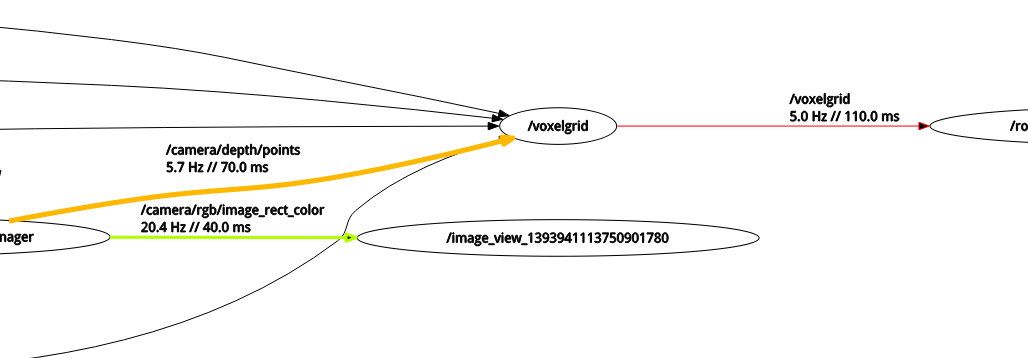
This is an example of rqt_graph with statistics measurement enabled:

Legend:
- "5.0 Hz" indicates the observed publish frequency.
- // "110.0ms" indicates the average age of the message (might be very large when replaying bag files without simtime).
- line color: red marks a high average age, green a young age. The limits are normed to the ages observed in the ROS graph.
line thickness: A thick line means the connection has a large throughput in Bytes/s (e.g. an unfiltered PointCloud).
